
In the US since 1949 inequality has increased with each expansion, with most gains going to the 1% (2 charts)
from David Ruccio
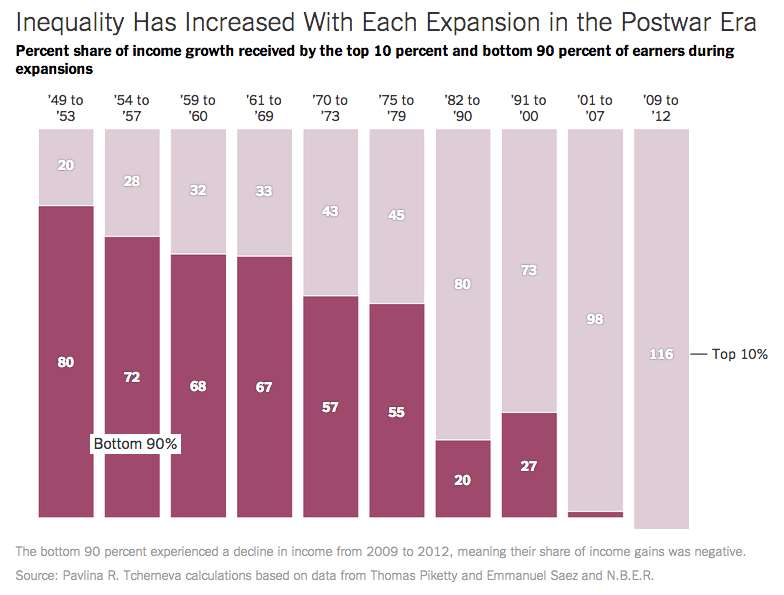
That’s right: during the first three years of the current “recovery,” the top 10 percent captured 116 percent of all income gains. That’s because incomes actually fell for the bottom 90 percent, even as they rose nicely for those at the top.
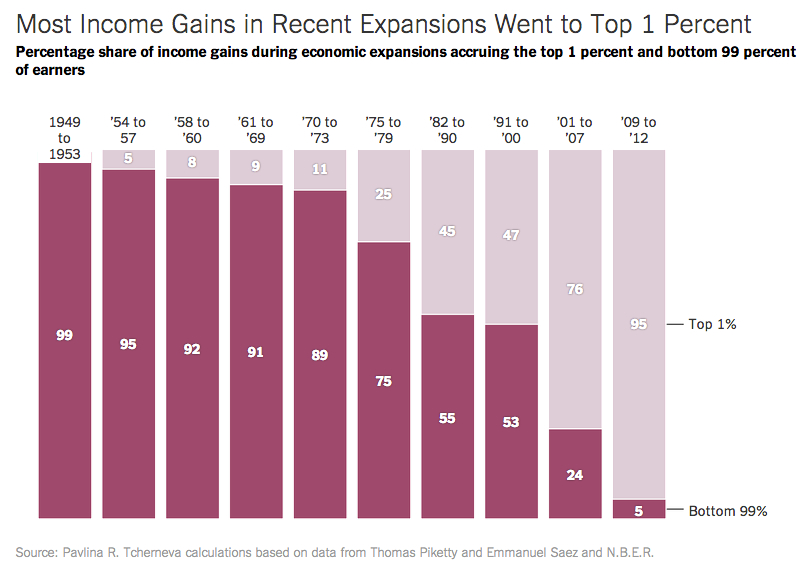
Even more striking is the fact that 95 percent of the income gains during the same period went to the top 1 percent, with only 5 percent left for everyone else.
In other words, the fruits of the current expansion have been captured almost exclusively by those at the very top—in contrast to every other period of economic recovery in the postwar period.
We have to face the fact that capitalism’s crises have become increasingly severe, and the solutions to those crises have increasingly involved redirecting the income gains to a tiny minority at the top. Everyone else is being left behind. Is it any wonder that the current economic system is facing a legitimation crisis?
Behind the unemployment headlines in the US (4 charts)
David Ruccio
I often explain to students, when I’m teaching economic models, they have to look at what’s happening behind the blackboard—all the implicit mechanisms that allow the models to work as they do.
By the same token, we have to ask, what’s going on behind the unemployment headlines?
The headlines today all trumpet the number of new jobs added in September (248,000), such that the official unemployment rate fell for the first time since August 2008 to below 6 percent (5.9 percent, to be exact).
That’s good news. Employment is picking up. But, of course, that’s not the end of the story. And Tyler Durden helps us see why.
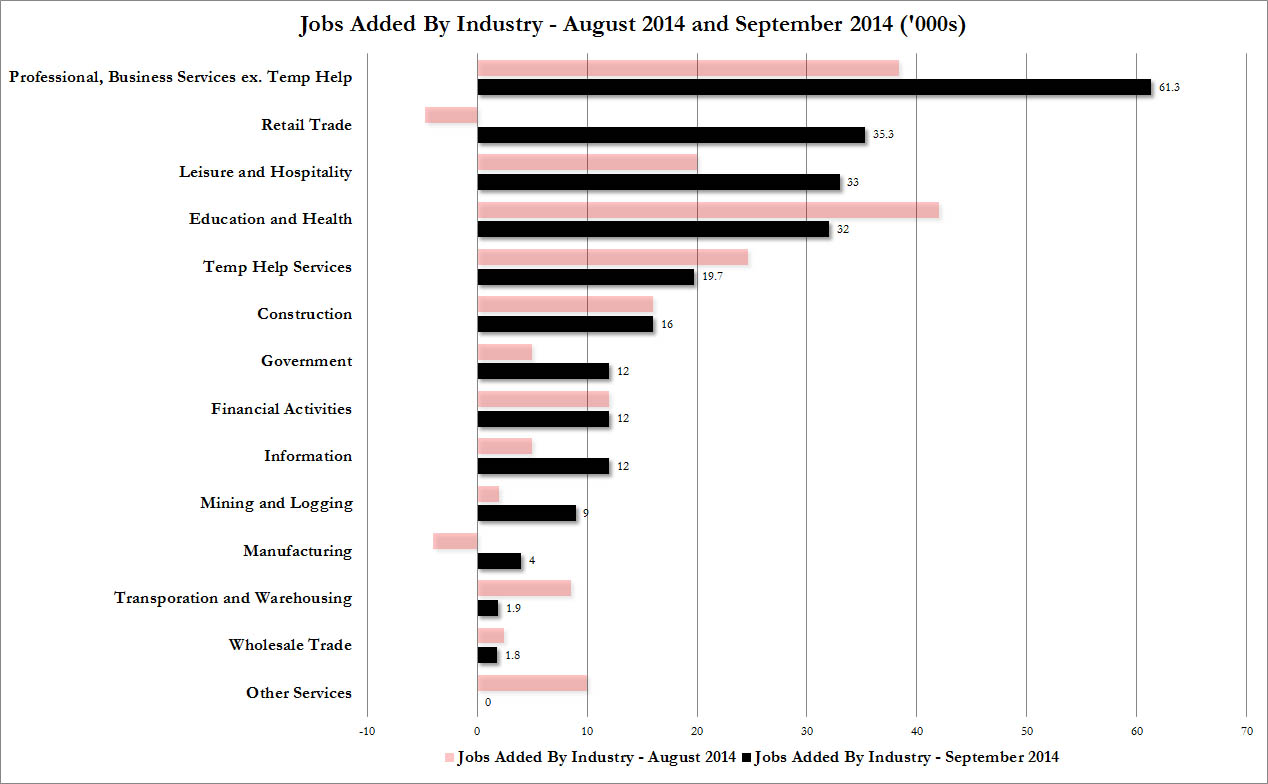
First, most of the new jobs (4 of the top 5 categories) were in retail trade, leisure and hospitality, education and health, and temp help.
So yes, America added a whole lot of minimum wage waiters, store clerks, groundskeepers and temps: truly the stuff New Normal “recoveries” are made of.

Second, the labor force participation rate dropped once again—from an already three decade low in August—to 62.7 percent. In other words, as against the 232,000 people who found jobs, the number of people not in the labor force rose to a new record high, increasing by 315,000 to 92.6 million!

And finally, even while new jobs are being created, hourly earnings are not moving at all (in fact, to be accurate, they actually declined by a penny from the $24.54 in August). In other words, real wages—accounting for inflation—continue to decline.
So, that’s what’s happening behind the triumphant unemployment headlines: the continued creation of lousy, low-paying jobs; the continued exit of hundreds of thousands of workers from the labor force; and the continued decline in real wages.
Anyone want to talk about the reserve army of labor?
The median net worth in the United States is, in real terms, lower today than it was in 1989.
from David Ruccio

The median net worth in the United States is, in real terms, lower today than it was in 1989.
As Matt O’Brien explains,
This is a story about stocks and houses. The middle class doesn’t have much of the former, which has rebounded sharply, but has lots of the latter, which hasn’t. Indeed, only 9.2 percent of the middle 20 percent of households owns stocks, versus almost half of the top 20 percent. So the middle class has not only missed out on getting a raise, but also on the big bull market the past five years.
The only thing they haven’t missed out on was the housing bust: 63 percent of that middle quintile own their homes, which are more likely to be a financial albatross than asset. And it doesn’t help that, with student loans hitting $1.2 trillion, people have to take out more and more debt just to try to stay in, or join, the middle class.
Real median income of working-age American families 1975-2013 (chart)
from David Ruccio

There are two periods to focus on in this recently updated chart of the real median income of working-age American families:
- From 1979 to 2007, the real median income of working-age families in the United States rose 17.4 percent, even though the hourly wage increased by only 13.9 percent—which means that Americans were forced to work longer hours and send more members of the household out to work in order to enjoy higher annual incomes. During the same period, labor productivity increased dramatically, by 58.9—which means that most of the income gains went to a tiny minority at the top and not to working-class families.
- During the past six years, the real median income of working-age families in the United States has actually declined by 8 percent—thus erasing all of the gains workers had made from 1996 onward.
The result? American workers and their families have suffered a prolonged period of immiseration—relatively, over the course of the past three-plus decades, and now absolutely, to add injury to insult, during the Second Great