Americans’ views on use of torture in fighting terrorism have been mixed
The so-called enhanced interrogation techniques put into practice by the Central Intelligence Agency after the September 2001 terrorist attacks and continued in subsequent years during the Bush administration are the focus of a report being released by the Senate Intelligence Committee — and a subject on which Americans have had mixed views.
 The use of practices like waterboarding began to surface publicly in press reports not long after 9/11, and when the Pew Research Center first surveyed on the subject in July 2004, a narrow majority (53%) said the use of torture to gain important information from suspected terrorists could be only rarely or never justified.
Opinion has shifted since then, with more Americans finding torture acceptable. In August 2011, a narrow majority (53%) of Americans said the use of torture could be often or sometimes justified, while 42% said it could only rarely be justified or not be justified at all.
A more recent poll by Associated Press/NORC conducted in August 2013 found similar results. Half said the use of torture could sometimes or often be justified while 47% said it could rarely or never be justified.
But polling has found that there are differences along party lines with Republicans more supportive than Democrats of torture with suspected terrorists. In our 2011 survey, a substantial majority of Republicans (71%) said torture could be at least sometimes justified, compared with 51% of independents and 45% of Democrats. In the AP/NORC poll, 66% of Republicans backed use of torture in dealing with terrorists compared with 53%

Bruce Drake is a Senior Editor at the Pew Research Center.
Even though many of the MSM-dependent people are the “low-information voters” we’ve heard about lately, and the MSM’s audience is much smaller than it was 40-50 years ago, there are still enough of them to register in public opinion polls. Hence, it should not surprise if future polls show a shift away from a recent (9/19-22/13) poll for the Pew Research Center that revealed the public was almost evenly balanced in assigning responsibility for the then-impending government closure. One must expect polls in the next few days or so will indicate Jane and John Q. Public place more blame (for the shutdown) on Republicans than on Democrats.
http://www.americanthinker.com/articles/2013/10/why_this_shutdown
_is_different.html#ixzz3NsMUGZVn
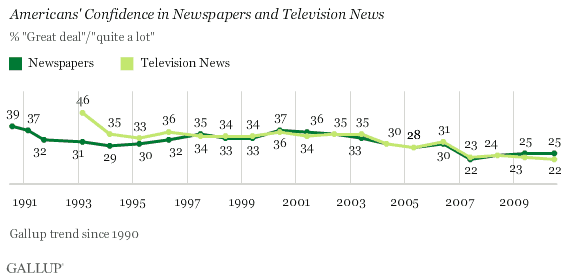
WASHINGTON, D.C. — Americans continue to express near-record-low confidence in newspapers and television news — with no more than 25% of Americans saying they have a “great deal” or “quite a lot” of confidence in either. These views have hardly budged since falling more than 10 percentage points from 2003-2007.

The findings are from Gallup’s annual Confidence in Institutions survey, which found the military faring best and Congress faring worst of 16 institutions tested. Americans’ confidence in newspapers and television news is on par with Americans’ lackluster confidence in banks and slightly better than their dismal rating of Health Management Organizations and big business.
The decline in trust since 2003 is also evident in a 2009 Gallup poll that asked about confidence and trust in the “mass media” more broadly. While perceptions of media bias present a viable hypothesis, Americans have not over the same period grown any more likely to say the news media are too conservative or too liberal.
No matter the cause, it is clear the media as a whole are not gaining new fans as they struggle to serve and compete with growing demand for online news, social media, and mobile platforms. The Pew Project for Excellence in Journalism’s annual report on the State of the News Media, released in March, found for a third straight year, only digital and cable news sources growing in popularity, while network news, local news, and newspaper audiences shrink. These findings align with a similar 2008 Gallup poll that found cable and Internet news sources growing in popularity while all others held steady or declined.
While it is unclear how much respondents factored in the online and cable offshoots of “newspapers” and “television news” when assessing their confidence in these institutions, their responses do not provide much encouragement for the media more broadly. Confidence is hard to find, even among Democrats and liberals, who have historically been the most trusting of the news media. While 18- to 29-year-olds express more trust in newspapers than most older Americans, Gallup polling has found they read national newspapers the least. Younger Americans also expressed more confidence than older Americans in several other institutions tested, including Congress, the medical system, and the criminal justice system, suggesting younger Americans are more confident in institutions in general.

Implications
With nearly all news organizations struggling to keep up with the up-to-the-minute news cycle and to remain profitable in the process, Americans’ low trust in newspapers and television news presents a critical barrier to success. The Pew report asserts that 80% of new media links are to legacy newspapers and broadcast networks, making clear that traditional news sources remain the backbone of the media. But so long as roughly three in four Americans remain distrustful, it will be difficult to attract the large and loyal audiences necessary to boost revenues.
Survey MethodsResults for this Gallup poll are based on telephone interviews conducted July 8-11, 2010, with a random sample of 1,020 adults, aged 18 and older, living in the continental U.S., selected using random-digit-dial sampling.
For results based on the total sample of national adults, one can say with 95% confidence that the maximum margin of sampling error is ±4 percentage points.
Interviews are conducted with respondents on landline telephones (for respondents with a landline telephone) and cellular phones (for respondents who are cell phone-only). Each sample includes a minimum quota of 150 cell phone-only respondents and 850 landline respondents, with additional minimum quotas among landline respondents for gender within region. Landline respondents are chosen at random within each household on the basis of which member had the most recent birthday.
Samples are weighted by gender, age, race, education, region, and phone lines. Demographic weighting targets are based on the March 2009 Current Population Survey figures for the aged 18 and older non-institutionalized population living in continental U.S. telephone households. All reported margins of sampling error include the computed design effects for weighting and sample design.
In addition to sampling error, question wording and practical difficulties in conducting surveys can introduce error or bias into the findings of public opinion polls.
For more details on Gallup’s polling methodology, visit http://www.gallup.com/.
www.gallup.com/poll/…/Confidence-Newspapers-News-Remains-…


