
21st century changes in the distribution of income in the USA
from David Ruccio
As Ed Dolan explains,
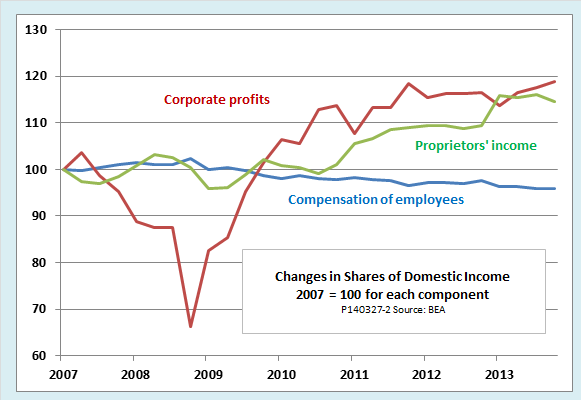
The chart [above] assigns a value of 100 to each component’s share in 2007, the year before the recession began. This chart shows that corporate profits were hit hard in the first months of the recession, but began to recover already by the end of 2008, when GDP was still falling. By the time the economy had officially entered the recovery phase in mid-2009, corporate profits were surging to new highs.
Compensation of employees and proprietors’ income behaved differently. During the downslope of the recession, the shares of those two components held fairly steady, that is, they decreased but only at about the same rate as GDI [Gross Domestic Income] as a whole. After mid-2009, when the economy began to recover, the two diverged. Proprietors’ income grew faster than GDI as a whole, so that its share increased. Compensation of employees grew less rapidly than GDI, so its share began to fall, and is still falling.
These trends in the shares of GDI components provide another view of the substantial changes in the distribution of income and wealth that are underway in the twenty-first century United States. The data shown in our charts are only indirectly related to the more widely publicized increase in the share of total income accruing to top earners, but they explain part of what is going on. It is true that some high earners receive the major part of their income in the form of salaries and bonuses, and that many middle-class families receive some corporate profit income throughmutual funds and retirement savings accounts. Still, corporate profits are more unequally distributed and compensation of employees less unequally distributed than income as a whole. That means the rising share in GDI of the former and the falling share of the latter are two of the factors behind the rising fortunes of the super-rich and the relative economic stagnation of the middle class.