The “Dharma Wheel” of Capitalism. With each of the imperatives a necessary but not sufficient condition of the next. Note contradiction between production versus realization of surplus value as all costs are incomes and as incomes and wealth are increasingly unequally distributed. It is called the “Henry Ford Effect”: Mass production and “efficiency” require mass demand and markets and those who produce the commodities able and willing (real incomes + “tastes and preferences”) to buy. The way out, those who rule think, in the short-run, anyway is rising Debt. Note also the contradiction between the values necessary for the production of maximum possible surplus value (workplace cohesion and cooperation, discipline, focus, constant learning) or/versus those required of the same workers as “insatiable consumers” willing to undertake back-breaking debt (e.g. egoism, ultra-individualism, impulsive, unable to delay gratification, fad and peer-influenced,)
The Plutonomy Symposium — Rising Tides Lifting Yachts
1% chart
from David Ruccio
As Niraj Chokshi explains,
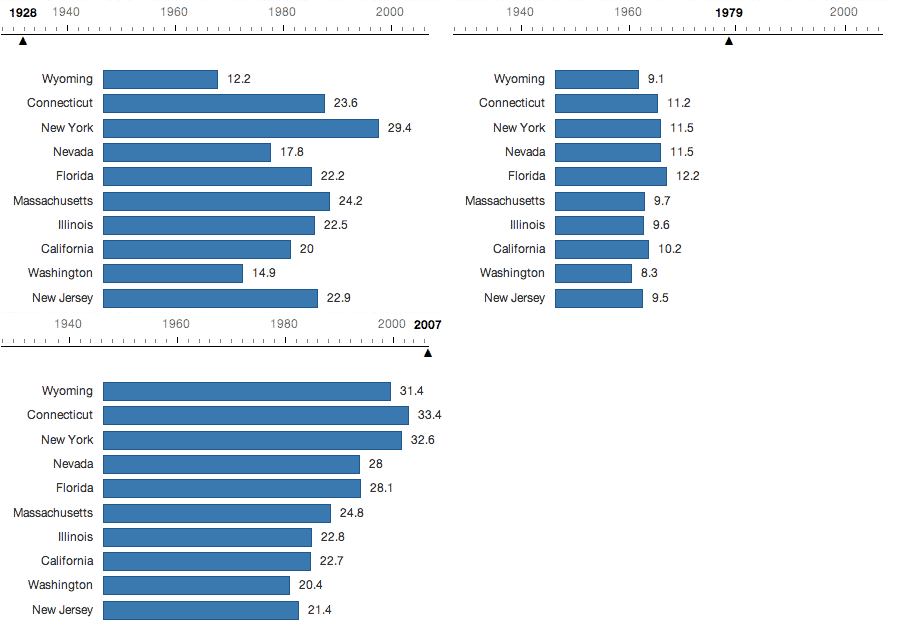
In each state in the nation, the top 1 percent of earners saw its share of the income pie grow between 1979 and 2007, according to a new 50-state study of income inequality. The change was starkest in Wyoming, where 9 percent of income belonged to the top 1 percent in 1979. By 2007, that top slice of earners laid claim to 31 percent of all income.
It hasn’t always been the case, though. As the GIF above [shows], the top 1 percent saw its share of all income shrink between 1928 and 1979. Over that half-century, the income pie was shared a little more equally. But since 1979, that trend reversed in every state
➤ Time to re-commit to plutonomy stocks – Binge on Bling.
Equity multiples appear too low, the profit share of GDP is high and likely going higher,
stocks look likely to beat housing, and we are bullish on equities. The Uber-rich, the
plutonomists, are likely to see net worth-income ratios surge, driving luxury consumption.
Buy plutonomy stocks (list inside).
➤ Plutonomy stocks at a premium, but relative pricing power is key.
➤ Our Plutonomy Symposium take-aways.
The key challenge for corporates in this space is to maintain the mystique of prestige
while trying to grow revenue and hit the mass-affluent market. Finding pure-plays on the
plutonomy theme, however, is tricky.
➤ Plutonomy and the Great Conundrums of our age.
We think the balance sheets of the rich are in great shape, and are likely to continue to
improve. Don’t be shocked if the savings rate worsens as equities do well.
➤ What could go wrong?
Beyond war, inflation, the end of the technology/productivity wave, and financial collapse,
we think the most potent and short-term threat would be societies demanding a more
‘equitable’ share of wealth.
Global — The Plutonomy Symposium — Rising Tides Lifting Yachts……………………….. 7
U.S. — Calibrating 2007 Targets ………………………………………………………………………. 21
Europe — Avoiding the Mega-traps…………………………………………………………………… 27
Japan — Birth of the Abe Administration ………………………………………………………….. 31
Asia-Pacific — If It’s Due to Speculation=Bullish;
If Due to Weaker Growth=Bearish…………………………………………………………………….. 37
Latin America — Think Small…………………………………………………………………………….. 43
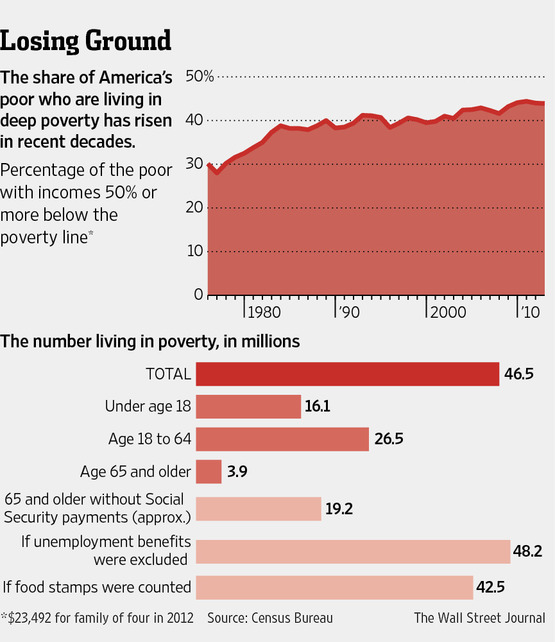
Two charts from the Wall Street Journal
October 13, 2013David F. Ruccio1 comment
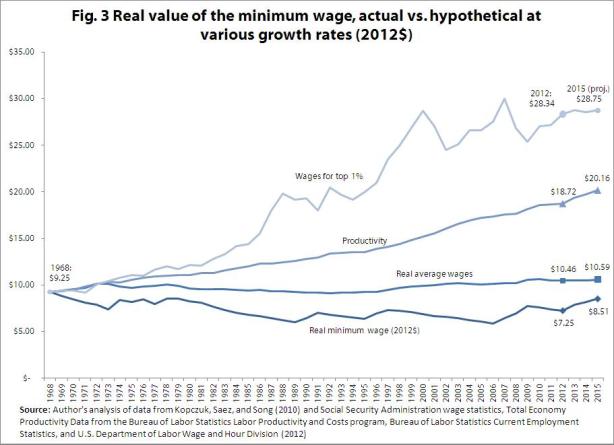
US wages and productivity 1968 – 2012 (minimum, average and The 1%)
February 21, 2013David F. Ruccio6 comments
US minimum wage: Who decided workers should fall behind?
from Dean Baker
It was encouraging to see President Obama propose an increase in the minimum wage in his State of the Union Address, even if the $9.00 target did not seem especially ambitious. If the $9.00 minimum wage were in effect this year, the inflation-adjusted value of the minimum wage would still be more than 2.0 percent lower than it had been in the late 1960s. And this proposed target would not even be reached until 2015, when inflation is predicted to lower the value by another 6 percent.
While giving a raise worth more than $3,000 a year to the country’s lowest paid workers is definitely a good thing, it is hard to get too excited about a situation in which these workers will still be earning less than their counterparts did almost 50 years ago. Read more…
Income redistribution in the United States 1913-2011 (2 graphs)
Citibank Plutonomy Report: Original
August 23, 2010
Reposted from http://www.scribd.com/doc/6674234/Citigroup-Oct-16-2005-Plutonomy-Report-Part-1, originally brought to my attention via Capitalism: A love story . If you have a short attention span or want to know why I posted this here, see my edited version Citibank Plutonomy Report: Essay on income inequality version.
Citigroup Equity Strategy
Plutonomy: Buying Luxury, Explaining Global Imbalances
October 16, 2005
Summary
- The World is dividing into two blocs – the Plutonomy and the rest. The U.S., UK, and Canada are the key Plutonomies – economies powered by the wealthy. Continental Europe (ex-Italy) and Japan are in the egalitarian bloc.
- Equity risk premium embedded in “global imbalances” are unwarranted. In plutonomies the rich absorb a disproportionate chunk of the economy and have a massive impact on reported aggregate numbers like savings rates, current account deficits, consumption levels, etc. This imbalance in inequality expresses itself in the standard scary ” global imbalances”. We worry less.
- There is no “average consumer” in a Plutonomy. Consensus analyses focusing on the “average” consumer are flawed from the start. The Plutonomy Stock Basket outperformed MSCI AC World by 6.8% per year since 1985. Does even better if equities beat housing. Select names: Julius Baer, Bulgari, Richemont, Kuoni, and Toll Brothers.
WELCOME TO THE PLUTONOMY MACHINE
In early September we wrote about the (ir)relevance of oil to equities and introduced the idea that the U.S. is a Plutonomy – a concept that generated great interest from our clients. As global strategists, this got us thinking about how to buy stocks based on this plutonomy thesis, and the subsequent thesis that it will gather strength and amass breadth. In researching this idea on a global level and looking for stock ideas we also chanced upon some interesting big picture implications. This process manifested itself with our own provocative thesis: that the so called “global imbalances” that worry so many of our equity clients who may subsequently put a lower multiple on equities due to these imbalances, is not as dangerous and hostile as one might think. Our economics team led by Lewis Alexander researches and writes about these issues regularly and they are the experts. But as we went about our business of finding stock ideas for our clients, we thought it important to highlight this provocative macro thesis that emerged, and if correct, could have major implications in terms of how equity investors assess the risk embedded in equity markets. Sometimes kicking the tires can tell you a lot about the car-business.
Well, here goes. Little of this note should tally with conventional thinking. Indeed, traditional thinking is likely to have issues with most of it. We will posit that:
1) the world is dividing into two blocs – the plutonomies, where economic growth is powered by and largely consumed by the wealthy few, and the rest. Plutonomies have occurred before in sixteenth century Spain, in seventeenth century Holland, the Gilded Age and the Roaring Twenties in the U.S. What are the common drivers of Plutonomy? Disruptive technology-driven productivity gains, creative financial innovation, capitalist friendly cooperative governments, an international dimension of immigrants and overseas conquests invigorating wealth creation, the rule of law, and patenting inventions. Often these wealth waves involve great complexity, exploited best by the rich and educated of the time.
2) We project that the plutonomies (the U.S., UK, and Canada) will likely see even more income inequality, disproportionately feeding off a further rise in the profit share in their economies, capitalist-friendly governments, more technology-driven productivity, and globalization.
3) Most “Global Imbalances” (high current account deficits and low savings rates, high consumer debt levels in the Anglo-Saxon world, etc) that continue to (unprofitably) pre- occupy the world’s intelligentsia look a lot less threatening when examined through the prism of plutonomy. The risk premium on equities that might derive from the dyspeptic “global imbalance” school is unwarranted – the earth is not going to be shaken off its axis, and sucked into the cosmos by these “imbalances”. The earth is being held up by the muscular arms of its entrepreneur-plutocrats, like it, or not.
Fixing these “global imbalances” that many pundits fret about requires time travel to change relative fertility rates in the U.S. versus Japan and Continental Europe. Why? There is compelling evidence that a key driver of current account imbalances is demographic differences between regions. Clearly, this is tough. Or, it would require making the income distribution in the Anglo-Saxon plutonomies (the U.S., UK, and Canada) less skewed to the rich, and relatively egalitarian Europe and Japan to suddenly embrace income inequality. Both moves would involve revolutionary tectonic shifts in politics and society. Note that we have not taken recourse to the conventional curatives of global rebalance – the dollar needs to drop, either abruptly, or smoothly, the Chinese need to revalue, the Europeans/Japanese need to pump domestic demand, etc. These have merit, but, in our opinion, miss the key driver of imbalances – the select plutonomy of a few nations, the equality of others. Indeed, it is the “unequal inequality”, or the imbalances in inequality across nations that corresponds with the “global imbalances” that so worry some of the smartest people we know.
4) In a plutonomy there is no such animal as “the U.S. consumer” or “the UK consumer”, or indeed the “Russian consumer”. There are rich consumers, few in number, but disproportionate in the gigantic slice of income and consumption they take. There are the rest, the “non-rich”, the multitudinous many, but only accounting for surprisingly small bites of the national pie. Consensus analyses that do not tease out the profound impact of the plutonomy on spending power, debt loads, savings rates (and hence current account deficits), oil price impacts etc, i.e., focus on the “average” consumer are flawed from the start. It is easy to drown in a lake with an average depth of 4 feet, if one steps into its deeper extremes. Since consumption accounts for 65% of the world economy, and consumer staples and discretionary sectors for 19.8% of the MSCI AC World Index, understanding how the plutonomy impacts consumption is key for equity market participants.
5) Since we think the plutonomy is here, is going to get stronger, its membership swelling from globalized enclaves in the emerging world, we think a “plutonomy basket” of stocks should continue do well. These toys for the wealthy have pricing power, and staying power. They are Giffen goods, more desirable and demanded the more expensive they are.
RIDING THE GRAVY TRAIN – WHERE ARE THE PLUTONOMIES?
The U.S., UK, and Canada are world leaders in plutonomy. (While data quality in this field can be dated in emerging markets, and less than ideal in developed markets, we have done our best to source information from the most reliable and credible government and academic sources. There is an extensive bibliography at the end of this note). Countries and regions that are not plutonomies: Scandinavia, France, Germany, other continental Europe (except Italy), and Japan.
THE UNITED STATES PLUTONOMY – THE GILDED AGE, THE ROARING TWENTIES, AND THE NEW MANAGERIAL ARISTOCRACY
Let’s dive into some of the details. As Figure 1 shows the top 1% of households in the U.S., (about 1 million households) accounted for about 20% of overall U.S. income in 2000, slightly smaller than the share of income of the bottom 60% of households put together. That’s about 1 million households compared with 60 million households, both with similar slices of the income pie! Clearly, the analysis of the top 1% of U.S. households is paramount. The usual analysis of the “average” U.S. consumer is flawed from the start. To continue with the U.S., the top 1% of households also account for 33% of net worth, greater than the bottom 90% of households put together. It gets better (or worse, depending on your political stripe) – the top 1% of households account for 40% of financial net worth, more than the bottom 95% of households put together. This is data for 2000, from the Survey of Consumer Finances (and adjusted by academic Edward Wolff). Since 2000 was the peak year in equities, and the top 1% of households have a lot more equities in their net worth than the rest of the population who tend to have more real estate, these data might exaggerate the U.S. plutonomy a wee bit.
Was the U.S. always a plutonomy – powered by the wealthy, who aggrandized larger chunks of the economy to themselves? Not really. For those interested in the details, we recommend “Wealth and Democracy: A Political History of the American Rich” by Kevin Phillips, Broadway Books, 2002.
Figure 1. Characterizing the U.S. Plutonomy: Based on the Consumer Finance Survey, the Top 1% Accounted For 20% of Income, 40% of Financial Wealth and 33% of Net Worth in the U.S. (More Than the Net Worth of the Bottom 95% Households Put Together) in 2001
Source: Table 2 from Edward Wolff (please see reference 26 in the bibliography at the end of the report). Computations done by Prof. Wolff from the 1983, 1989, 1992, 1995, 1998, and 2001 Surveys of Consumer
Source: Table 2 from Edward Wolff (please see reference 26 in the bibliography at the end of the report). Computations done by Prof. Wolff from the 1983, 1989, 1992, 1995, 1998, and 2001 Surveys of Consumer Finances. For the computation of percentile shares of net worth, households are ranked according to their net worth; for percentile shares of financial wealth, households are ranked according to their financial wealth; and for percentile shares of income, households are ranked according to their income. Net worth in Prof Wolff’s calculation is the difference in value between total assets and total liabilities or debt. Total assets are defined as the sum of: (1) the gross value of owner-occupied housing; (2) other real estate owned by the household; (3) cash and demand deposits; (4) time and savings deposits, certificates of deposit, and money market accounts; (5) government bonds, corporate bonds, foreign bonds, and other financial securities; (6) the cash surrender value of life insurance plans; (7) the cash surrender value of pension plans, including IRAs, Keogh, and 401(k) plans; (8) corporate stock and mutual funds; (9) net equity in unincorporated businesses; and (10) equity in trust funds. Total liabilities are the sum of: (1) mortgage debt, (2) consumer debt, including auto loans, and (3) other debt. Prof Wolff defines Financial wealth as net worth minus net equity in owner-occupied housing. Financial wealth is a more “liquid” concept than marketable wealth, since one’s home is difficult to convert into cash in the short term.
Citigroup-Plutonomy-Report-Part-1
Citigroup_Plutonomy_Report_Part_2
citibank plutonomy symposium memo3
RELATED ARTICLES:


