Divergence at the top – the 0.01%
from David Ruccio

As Annie Lowrey explains,
It is not just that the rich have pulled away from the average American. It is that the richer you are, the more you have pulled away. . .
The higher a household is on the income scale, the more likely it is that a big chunk of its earnings come from investments rather than wages. Managers at Wall Street firmstend to take home options and shares, for instance, and chief executives often get stock as part of their compensation packages. . .
For now, it is a very good time to be very, very rich. The 1 percent are doing well. The 0.01 percent — they’re doing even better.
And Mark Gongloff adds,
Ronald Reagan helped start the ball rolling by slashing taxes on the rich, and his economists claimed the wealth would trickle down to the rest of us. Something has trickled down on us, all right, but it wasn’t wealth: The average income of the bottom 90 percent is actually lower today, adjusted for inflation, than in the late 1970s. The top 0.01 percent makes now roughly 1,000 times as much as the bottom 90 percent, up from about 120 times as much in the late 1970s.
And many of the factors driving this inequality — over-inflated executive pay, a bloated banking sector, low taxes
Home > upward income redistribution > 1% chart1% chart
from David Ruccio
As Niraj Chokshi explains,
In each state in the nation, the top 1 percent of earners saw its share of the income pie grow between 1979 and 2007, according to a new 50-state study of income inequality. The change was starkest in Wyoming, where 9 percent of income belonged to the top 1 percent in 1979. By 2007, that top slice of earners laid claim to 31 percent of all income.
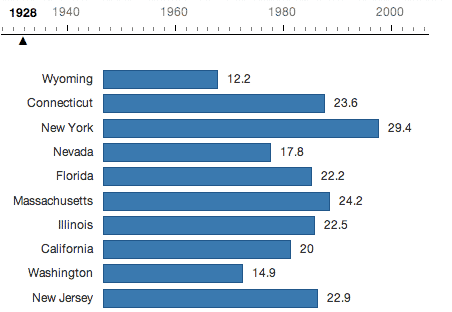
It hasn’t always been the case, though. As the GIF above [shows], the top 1 percent saw its share of all income shrink between 1928 and 1979. Over that half-century, the income pie was shared a little more equally. But since 1979, that trend reversed in every state
from David Ruccio
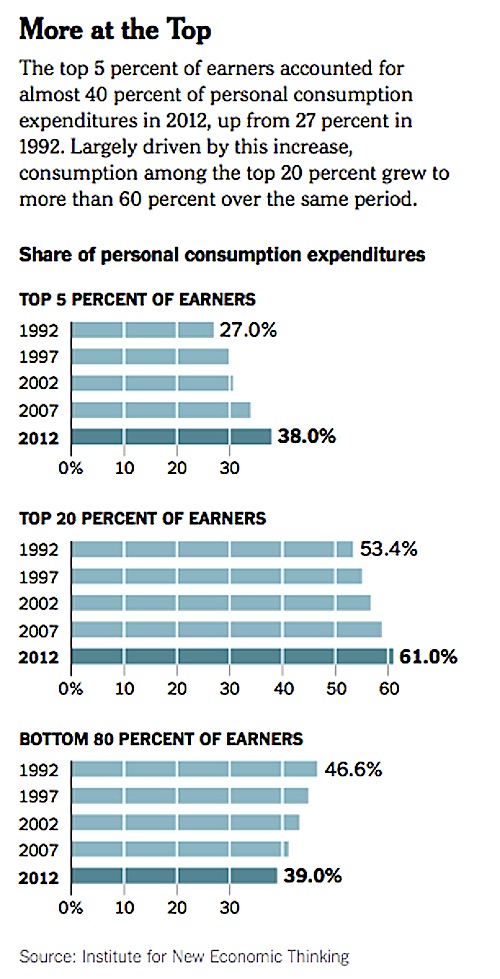
As the New York Times reports, based on a recent paper by Barry Cynamon and Steven Fazzari [pdf],
In 2012, the top 5 percent of earners were responsible for 38 percent of domestic consumption, up from 28 percent in 1995, the researchers found.
Even more striking, the current recovery has been driven almost entirely by the upper crust, according to Mr. Fazzari and Mr. Cynamon. Since 2009, the year the recession ended, inflation-adjusted spending by this top echelon has risen 17 percent, compared with just 1 percent among the bottom 95 percent.
More broadly, about 90 percent of the overall increase in inflation-adjusted consumption between 2009 and 2012 was generated by the top 20 percent of households in terms of income, according to the study, which was sponsored by the Institute for New Economic Thinking, a research group in New York.
The effects of this phenomenon are now rippling through one sector after another in the American economy, from retailers and restaurants to hotels, casinos and even appliance makers.
For example, luxury gambling properties like Wynn and the Venetian in Las Vegas are booming, drawing in more high rollers than regional casinos in Atlantic City, upstate New York and Connecticut, which attract a less affluent clientele who are not betting as much, said Steven Kent, an analyst at Goldman Sachs.
Among hotels, revenue per room in the high-end category, which includes brands like the Four Seasons and St. Regis, grew 7.5 percent in 2013, compared with a 4.1 percent gain for midscale properties like Best Western, according to Smith Travel Research